Digital factory transformation beyond serialization compliance

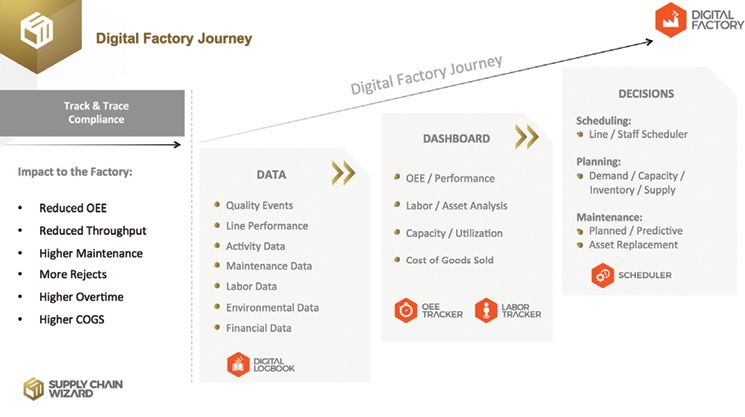
Fig. 1. A serialization program can be the first step toward managing overall packaging line performance. Credit: SCW[/caption]
“Serialization” is like a new
blockbuster drug
for supply chains that is used in the “treatment” of counterfeiting or falsifications, while also helping with the quality and integrity of supply chains. Truly a game changer. It is already in the works in more than 40 countries around the world, and more countries are getting ready to adapt this new treatment. However, like every great drug, there are always some side effects, which you might miss, unless you read the fine print (i.e., talk to experts or early adaptors). For serialization, these side effects are not to be underestimated, as it can make parts of your supply chain quite miserable, while trying to improve the others.
Two of the main side effects of serialization compliance is the loss of efficiency in packaging operations and warehouse operations. As manufacturers are getting ready to comply with the US Drug Supply Chain Security Act (DSCSA) and the EU Falsified Medicines Directive (FMD), a few thousand manufacturers will go through this painful journey of installing and validating new serialization (and aggregation) hardware and software on their packaging lines. An estimated 10,000+ lines will eventually be upgraded, and industry surveys suggest that the majority of these implementations have not even started yet. As the deadlines for manufacturers/packagers come before the 3PLs and wholesalers, let us focus on the “side effect #1”: overall equipment effectiveness (OEE) loss in packaging lines.
As one of the early movers in this field, Supply Chain Wizard has helped a variety of manufacturers implement serialization compliance solutions around the world, spanning most of the leading packaging line solution providers. We can conclude that, in almost all cases, there is an inevitable loss of OEE. Key questions that the manufacturers should be asking are:
- Why do we
have OEE loss due to serialization?
- How much is
the expected efficiency loss?
- What can we
do about it?
The efficiency losses happen because there is a set of new equipment being introduced to the line with additional reject bins. New reject bins imply more rejects (i.e., reduction in throughput) and more machines imply more downtime by default. On top of that, the complexity of these systems requires more training, and the human factors added to the equation are causing even more stoppages on the line. Typical loss is around 5–10% of OEE, after the ramp-up and stabilization of the operations. However, early on during ramp-up, losses of more than 30% have been observed. In rare instances, the OEE losses could be mitigated by introducing some level of automation to the line, which require additional investments. The main challenge the industry is facing is that these levels of efficiency losses could mean the difference between profitable and non-profitable businesses, especially in the contract manufacturing/packaging world. For all manufacturers, it means direct negative impact to the bottom line, in terms of higher cost of goods sold.

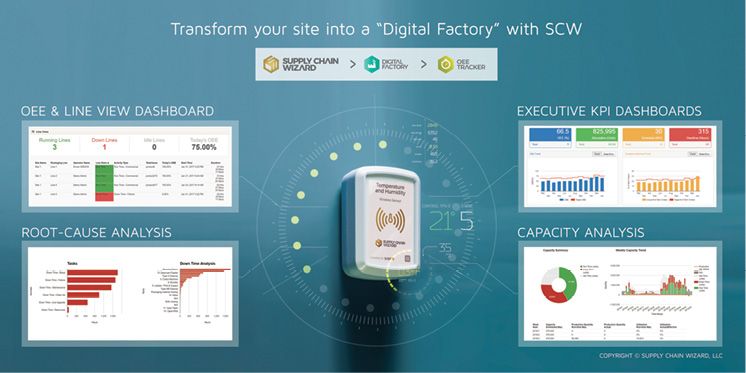
Fig. 2. Wireless monitors can gather data for an overall “digital factory” view.[/caption]
Once the manufacturers go through their own initial line implementations and resulting efficiency losses, proactive ones start contemplating pilot projects to improve OEE levels. Measuring OEE baseline before any action is taken is a fundamental first step towards minimizing the losses. The baseline data collection, however, should be “digital” in order to be repeatable and sustainable, instead of being paper based. As the digital data collection on the line activities ramp up, the foundation for a “digital factory transformation” is being put in place. Serialization compliance solutions are only putting verified unique serial numbers on each pack, while an activity we’ll call “digital activity tracking” will start enhancing the serial number data with operational data in such a way that will enable the humble beginnings of a “Digital Factory Transformation.”
Digital Factories are the factories of the future, whereby every process or activity, personnel and product is tracked at granular levels, and such information collected from the operations is used for generating insights (e.g., exceptions, trends, patterns, projections) and for better data-driven decisionmaking (e.g., asset replacement, work order schedules, staffing levels and more). Over time, these systems will turn into learning systems, where more data and insights are used in more automated decisionmaking, creating a virtuous circle of continuous improvement. (Fig. 1)
Digital Factory Transformation in 3D
The digital factory of tomorrow will be in “3D”: Data, Dashboards and Decisions, a three-phased digital transformation process to enable the promise of smart manufacturing (what is coming to be known as Industry 4.0). The 3D journey is from data to dashboards to decisions, from more basic and lower-value drivers to more sophisticated and higher-value drivers. First, let’s better define these three horizons of transformation:
- Data: Enriched dataset at the level of unit via unique serial numbers and product visibility along the supply chain is just the beginning of a major data transformation. Internet of Things (IoT) technologies, such as wireless sensors, provide many opportunities to enhance datasets collected by traditional transaction-based systems like ERP, MES and WMS. Unit level product tracking (status, location, environmental factors, duration, carriers, etc.) together with data enrichment processes to associate commercial data (e.g., price, discounts, chargebacks, returns) to the serial numbers will dramatically increase supply chain visibility.
- Dashboard: The ability to convert sets of data into meaningful and actionable insights through business and management metrics and visualizations, via role-specific dashboards. For example, a digital factory manager would be able to see a live dashboard of all their production lines with their status (running, down, idle) and the analysis of why the lines are not performing per their target OEE levels for a given time period. Using these dashboards, business patterns could be highlighted, and issues can be addressed faster and more effectively. Similarly, positive outcomes could be measured and input conditions could be replicated at most granular levels (e.g., Operator A runs product X on Line 1 on Mondays more efficiently than any other combination).
- Decisions: Decisionmaking is the ultimate change in behaviors that impact operations. Therefore, data and dashboards are only useful if the management is changing their actions accordingly. In the ultimate sense, the decisionmaking process could also be digitized by the use of optimization algorithms and machine-learning systems. For example, the scheduling of work orders to the packaging lines with the use of real-time data on line efficiencies, staff schedules and line availabilities could bring significant cost savings due to overtime/waste reduction, while increasing capacity and throughput.
OEE Tracker in Action: A Case Study in Factory Digitization
Late in 2015, one of our clients was faced with the challenge of significant efficiency loss while upgrading their pilot bottle-packaging line with serialization/aggregation technologies—they wanted to optimize their line efficiency despite these challenges, as they were concerned with overall impact to the site after achieving serialization compliance. (Fig. 2) After taking some time to understand the unique nature of the issues, we jointly developed a solution designed to help optimize the way they track their operations—digitally; later we named the solution as “OEE Tracker.”
As the pilot project continued over 12 months, expanding into all the packaging lines at the site, it became clear that the OEE Tracker would be the answer to uncover and remedy many of their issues, highlighting areas of immediate and significant improvement.
Visibility
By replacing manual and/or paper-based tracking activities with that of digital tracking capabilities, the biggest improvement happened in operational visibility. Our clients started seeing live dashboards of their operations, unexpected stops and delays in production, as well as the root causes of these issues (e.g., specific machines in a line). Once the solution was implemented at multiple lines, it also provided a capability to compare and contrast similar lines, their efficiency levels and emerging problems by consistently measuring and tracking the operations across these lines.
Variability
The second biggest source of improvement came with a “moment of revelation” when certain procedure-driven activities showed significant variability in duration during the initial pilot study. Our client started noticing areas of variability, together with the identified sources of variability, which helped improve the tracking capabilities of the solution to clearly identify and capture the root causes of these variabilities. For example, the number of available operators it takes to conduct a certain procedure is an important input to capture, which often correlates significantly with the duration of those procedures.
Exceptions
Once the visibility and newly found capability of variability tracking were put in place, then came the definition of what is regular or acceptable, and what is an exception. Most of the activities tracked could be assigned an expected duration, a possible minimum and a maximum allowed duration (i.e., lower and upper limits). Algorithms automating the reporting of exceptions (i.e., below minimum or above maximum), made it an easy task to get daily or weekly digest emails highlighting just the exceptions for managers to focus on.
Communication
Through deep collaboration and data-driven discussions, another important area for troubleshooting was identified as the time it takes to find the right personnel to conduct their duty when required at a given line. For example, bringing the right quality assurance (QA) personnel to release the line after it has been cleaned could sometimes take up to an hour or more of wait time. Similarly, finding the right mechanic and making him come to the line to fix an issue could take significant time, causing additional line stoppage. A simple “call support” function implemented in the OEE Tracker solution, emailing/texting the right person with the right information, significantly reduced this avoidable downtime.
Scheduling
The real improvement in efficiency is not possible until a true change of operational behavior is achieved. Being digitally tracked already contributed to our client’s OEE performance, where without any policy change, an improvement of 10–15% is achieved by the change in behavior of supervisors and operators. More fundamental performance improvement, however, required a new look at the way the work orders are scheduled to the lines to minimize overtime and reduce changeovers. Given a digitally strong foundation of OEE Tracker and digital log book of all shop floor activities, a more robust way of creating the shop floor schedule was created. Early results from the analysis of actual monthly schedule data showed very promising results with a 10–20% reduction in labor cost, primarily due to reduced overtime, and a possible increase in capacity/throughput of 20–40% with better scheduling capabilities using mathematical modeling and machine-learning algorithms to use constantly improving data-sets for decisionmaking.
Conclusion
In all, our work with our client improved the way they manage their packaging operations. After using our OEE Tracker solution, they could quickly highlight areas that impede productivity, as well as calculate and utilize metrics on their line operations for improved efficiency. Having worked extensively with our client, we have concluded that, while data is important, all three aspects of “3D”—including dashboards for operational insights and decisions for actual step change in behavior—must work together to form a complete solution, one that we know is possible with the support of software solutions, IoT sensors, and an open-minded and supportive leadership.
The Digital Factory Transformation journey could be new to many companies and sites, however, with the serialization compliance requirements and side effects on efficiency, more and more companies will embark upon this journey in the near future.
ABOUT THE AUTHOR
By Evren Ozkaya, Ph.D., is founder and CEO, Supply Chain Wizard, LLC.
Save
Save
