Using patient journey insights to tailor delivery of services
Deep analysis of specialty pharmacy data shows opportunities for managing the patient journey
In 2018, the US FDA approved 63 novel drugs and biologics—and a staggering 44 of the approved products are considered specialty. The prevalence of specialty products launching and progressing through the development pipeline is giving rise to a nearly equal number of Patient Support Programs (PSPs) programs meant to achieve very laudable goals like improved access to therapy and comprehensive disease education.
These programs are a lifelin7e for patients who are prescribed specialty products that bear many or all of the following characteristics: 1) high cost; 2) special handling and storage requirements; 3) severe side-effect profile; 4) complex treatment regimen.
As PSPs are mapped out and implemented for launch or as programs are recalibrated post-commercialization, a number of external and internal inputs inform program design. Presently, data and analytics capabilities needed to evaluate the effectiveness of PSPs as a whole or their component parts on an ongoing basis are not sufficiently mature. There is, however, a very real desire in the pharmaceutical industry to connect successful patient journey outcomes with service utilization information as part of an overall data and insights strategy.
There’s an important distinction to make between longer-term strategic program design and tactical, day-to-day patient case triage. Overall program design about the most effective model for a brand and investment in certain areas to deliver the best possible support to the patient and provider are made on an annual basis. Actionable insights surfaced in many of the analytics described here inform, prioritize, and direct daily case triage at the individual patient level.
Taking a step back, you first need to develop robust capabilities to identify the drivers of patient abandonment (cancellations) and therapy discontinuation. These insights are critical data points that will inform what patient services have the greatest potential impact along the journey, e.g., nurse support prior to month three of therapy.
This article will unpack a number of conceptual analytics that identify the root cause of therapy cancellations and discontinuations. It will also describe how these insights create a direct feedback loop to enable more data-driven patient engagement. Looking to the future, the incredible potential of predictive and prescriptive analytics for PSPs, in the context of analog patient cases, will be explored.
Naturally, there are limitations and roadblocks that could slow the industry’s adoption of data-driven patient engagement solutions. Legal and compliance teams often advocate limiting data access to select internal stakeholders and partitioning specialty pharmacy patient-status data and services utilization data. These concerns are generally more entrenched in large pharma organizations than among smaller, startup biotechs. It is worth noting that attitudes on the ground are shifting as it relates to the joining of these two data universes. Poor quality patient-status data is another factor that limits the industry’s ability to triage patient cases, take action to improve the patient journey, and gather insights to inform PSP design. A number of benchmarks to illustrate these issues as well as solutions to address underlying data quality will be presented.
Identifying cancellation and discontinuation drivers
Fig. 1. Time to First Fill and Fill Rate calculations reported in the ICyte platform for specialty brands in four therapeutic categories.
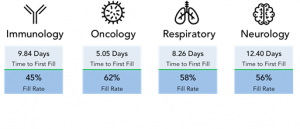
Metrics like Time To First Fill (TTFF) and Fill Rate (FR) vary significantly across specialty therapeutic categories (Fig. 1). The benchmark data referenced in this article includes four broad therapy areas -- Immunology, Oral Oncology, Respiratory, and Neurology. When determining a PSP model that is most effective for a particular brand, the key is to always understand what’s driving those metrics. Why is TTFF seven days on average? For patients waiting to initiate on therapy (Pending SP Patient Status), where in the journey are they stalled?
Actionable vs. non-actionable cases
The facts and figures cited here are derived from patient status data as reported by SPs and ingested and analyzed via IntegriChain’s ICyte platform. Patient status data is meant to record the sequence of steps in a patient journey as well as the time a patient spends in each step. The four top-level categories of patient status data are “Pending,” “Cancelled,” “Active,” and “Discontinued.” Benchmark data related to patient status cited in this article will use the format “Status-Sub-Status,” e.g., “Pending-New.”
Often, the richest source of therapy initiation intelligence is a trend analysis of cancellations—the reasons reported when scripts fail to initiate. When analyzing cancellation reasons, you want to understand which drivers are actionable and which are not.
Fig. 2. Cancellation reasons as reported by specialty pharmacies in the ICyte platform across all therapeutic categories for 2018.
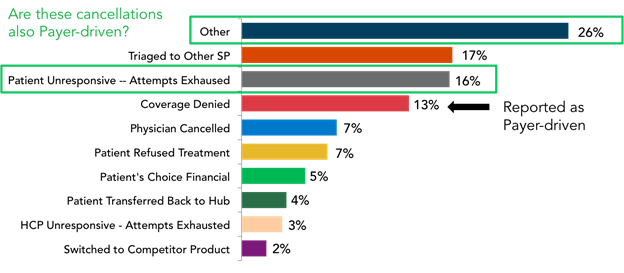
Fig. 2 shows commonly reported cancellation reasons as reported by an SP. The challenge for patient support teams—specifically, the Field Reimbursement team—is that “Payer-related” reasons account for only 13% of cases as explicitly reported by the SP. Meanwhile, another 42% of cancellations reported here are either “Cancelled-Other” or “Cancelled-Patient Unresponsive.” A deeper analysis of the underlying patient journey sequence for that 42% cohort reveals more cancellations that meet the criteria for actionable. More than half of those 42% reported as Cancelled-Other or Cancelled-Patient Unresponsive were pending in Prior Authorization (PA), or experienced a denial in the step prior to cancellation. We can then say with confidence that payer-driven cancellations account for at least one third and they are most likely closer to 40% of overall cancellations across the four broad therapeutic areas.
Fig. 3. Discontinuation reasons across all therapeutic categories for 2018.
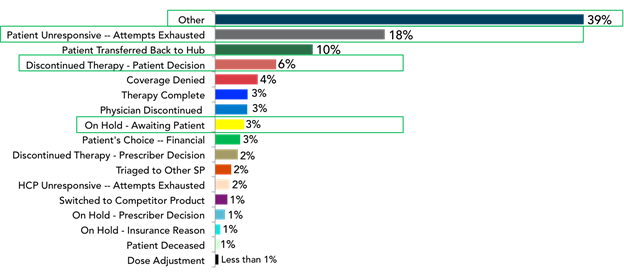
When a similar set of therapy discontinuation reasons reported by the SPs across the same four therapeutic areas was analyzed (Fig. 3), the lack of insight available is concerning. In roughly 66% of reported cases, there is no opportunity to learn why these patients are dropping off therapy, as the reasons are not being reported. The lack of detail around discontinuations reported by SPs may not be an operational shortcoming but simply a lack of knowledge. As a result, there are few feedback mechanisms available to inform program design or measure program effectiveness.
Quality of nursing support program data
The reasons for therapy discontinuation reported by nurse programs are another story. When ICyte dataset is analyzed, one finding is that 20% of consented, enrolled patients across brands had Nurse Navigator support service available. Further, a detailed discontinuation code was available for 80% of patients who discontinued therapy. The catalyst for this level of analysis around discontinuations is the integration of longitudinal, de-identified SP patient status data and nurse call notes.
Concept analytics for data-driven patient engagement
The benchmarks introduced in the previous section conveyed the importance and benefit of analyzing the drivers of cancellations and discontinuations along a brand’s patient journey. The distinction between actionable and non-actionable patient cases depends on the availability of high quality data.
Next Best Action (NBA) analytics offers an additional layer of data insights and levers to design patient support strategies that are evidence-based. Many of the advanced analytics gaining traction and industry adoption are at the tactical, individual patient level. Ultimately, use of NBA and other advanced analytics is to move away from retrospective trend analysis model and toward a proactive and predictive model.
Boosting fill rate through targeted reimbursement support
The first concept is fairly straightforward: “Understanding First Fill Sensitivity Points” (Fig. 4). Logically, we almost universally observe a direct correlation between the number of days that a script is Pending and the probability that a script converts.
Fig. 4. The relationship between probability a script will fill for new patient referrals and the number of days a script is pending. Drivers of stalled scripts are pictured for each abandonment cliff.
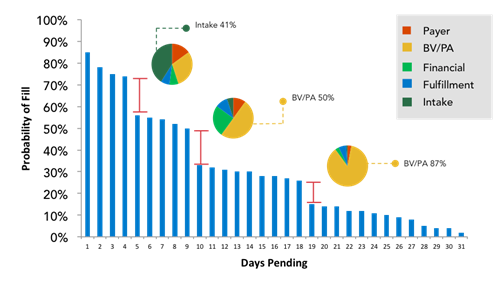
With that said, the sensitivity points or abandonment cliffs can vary between specialty brands and between therapeutic areas. This analysis focuses on understanding the mix of drivers for each abandonment cliff. At a point in time where we observe a radical cliff or drop off, how many scripts dropped off at the “Benefits Verification/Prior Authorization” step? How many of those scripts dropped off with benefits fully approved or another step short-circuited the patient’s journey? Once these details are fully understood, field reimbursement teams can get to the work of creating intervention strategies to close these gaps.
Predicting challenging patient initiation cases
In a previous section, it was noted that patients grow more vulnerable to abandonment cliffs with each successive day stalled waiting to start therapy. We also stipulated that a goal of this set of analytics is to move from a retrospective model to a more proactive posture. Predictive analytics and data strategies hold even more promise at avoiding the abandonment cliffs altogether. Imagine a case of patient initiation sending up a flag to the field reimbursement team when a historically challenging case presents at the pharmacy. Using a combination of machine learning, artificial intelligence (AI) and data science, we can make great strides to reduce primary and secondary medication non-adherence.
In this example, analog patient cases and historical patient journey outcomes train the AI algorithm to spot potentially problematic combinations. There are bad combinations of Payer, Provider, Pharmacy, and Brand where patients are more likely to experience a difficult patient journey. The goal of the “Predictive Initiation Analysis - Patient Risk Score” analytic is to automate the process of teasing out those combinations associated with the highest risk of patient abandonment of therapy. As the SP network reports new patient referrals in patient status data, the AI algorithm recognizes these combinations and is able to predict a problematic initiation.
Tailoring services to mitigate Gap Day and Discontinuation risk
Analyzing persistence by month of therapy is the first step in developing a data-driven intervention strategy. The timing of patient discontinuation as well as the number of patients dropping off therapy from a given cohort will inform field reimbursement teams to proactively engage to mitigate risk. More advanced analytics dig deeper into the mix of discontinuation drivers at a point in time (Fig. 5).
Figure 5: This concept of analytic for discontinuation shows a patient persistence decay curve overlaid with discontinuation drivers by month of therapy.
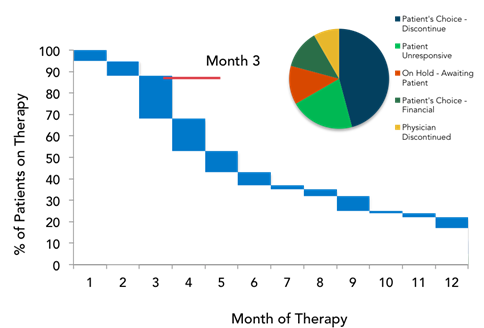
Here we’re moving in the direction of prescriptive analytics as the timing/drivers of discontinuation point to very tailored engagement. For example, if we observe a high discontinuation rate at Month Three driven by a “Patient Financial Decision,” creating awareness of copay card programs or a financially focused messages that are delivered by a nurse educator can be effective strategies to mitigate abandonment risk.
An additional lever is available to increase the value of this analytic. Maintaining a rich analog library of flagged patient cases, patient support interventions, and success rate of past interventions in keeping patients adherent to therapy, makes the move toward prescriptive action possible.
A complementary analytic to assess discontinuation risk measures the “Proportion of Days Covered” (PDC) or “Medication Possession Ratio” (MPR). PDC is used in this example. A drop in PDC indicates a gap day sensitivity point. A more advanced analytic integrates gap-day sensitivity point data with reported discontinuation reasons (nurse-program reported reasons, if available) to provide context around potential gap day drivers such as financial, side effects and medication efficacy.
Fig. 6. Identifying gap day sensitivity points using Proportion of Days Covered (PDC) and Month of Therapy overlaid with discontinuation drivers for a point in time.
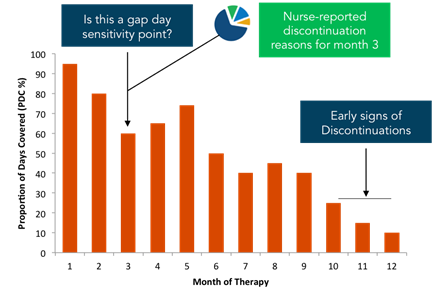
The analytic pictured in Fig. 6 allows your patient support team to take a proactive and adaptive approach to improve therapy adherence in two ways:
1. Determine when teams are hyperactive in response to a gap day
2. Align nurse and digital engagement to missed refills, historical gap-day timing, and historical discontinuation reasons
Mature data enables action
There is a significant amount of work needed to get SP patient status and complementary datasets to a point where they’re able to fully support the use cases that have been described. The good news is that analytics are now mature enough to operationalize data in the real world to risk score patient initiation, measure SP performance, and prioritize stalled patient case triage for FRM teams. There is still work to be done to create visibility and actionable data models across the entire patient journey.
Has your specialty brand implemented the basics of PHI de-identification, patient data integration, and then immediately leapt to reporting, metrics, and visualizations? If that’s the case—as it often is—the patient journey insights so desperately needed are locked away in those elusive intermediary steps of stewarding the data, cleansing the data, mastering the data, and enriching the data. These steps make it possible for the information to inform the use cases around First Fill Sensitivity, Predictive Patient Initiation, and Tailored Patient Intervention. To develop an SP data quality improvement plan, you need a baseline measurement of present state. Start with a serious evaluation of your data stewardship processes and follow up by pressure testing the timeliness, accuracy, and granularity of your SP patient status data.
About the Author

Josh Halpern ([email protected]) co-founded IntegriChain in 2006 and is the company's EVP, Product & Strategy. Josh is responsible for IntegriChain’s product teams, R&D, marketing, and corporate development. Josh is a leading expert in life sciences commercial data and analytics, with a focus on specialty drug commercialization and patient access.